


INTRODUCTION
The injury to the brain results in activation of the inflammation cascade resulting in secondary insult, brain injury and negative outcomes1,2). There is increasing role of routine laboratory parameters in identifying and quantify neuroinflammation and systemic inflammation and thus predicting the outcome in various neurological disorders3-12). This has led to the need to identify reliable, accessible, and cost-effective biomarkers that can help predict the outcome following injury to the brain11).Many studies have explored the role of analysis of complete blood count (CBC) parameters to screen the inflammation and its impact on neurological outcomes11). The parameters of interest include a neutrophil-to-lymphocyte ratio (NLR), red cell width distribution (RDW), red cell width (RDW)-to-platelet ratio (RPR), and NLR times RPR (NLTRP)8-12). Red cell distribution width (RDW) to platelet count ratio (RPR) is a ratio of RBC distribution width (RDW) to platelet count and has been studied to correlate with reflecting the severity of inflammation and prognostication in various diseases13,14).The objective of the present scoping review is to evaluate the prognostic value of Red Cell Distribution Width to Platelet Count Ratio (RPR) in various neuropsychiatric disorders.
METHODS
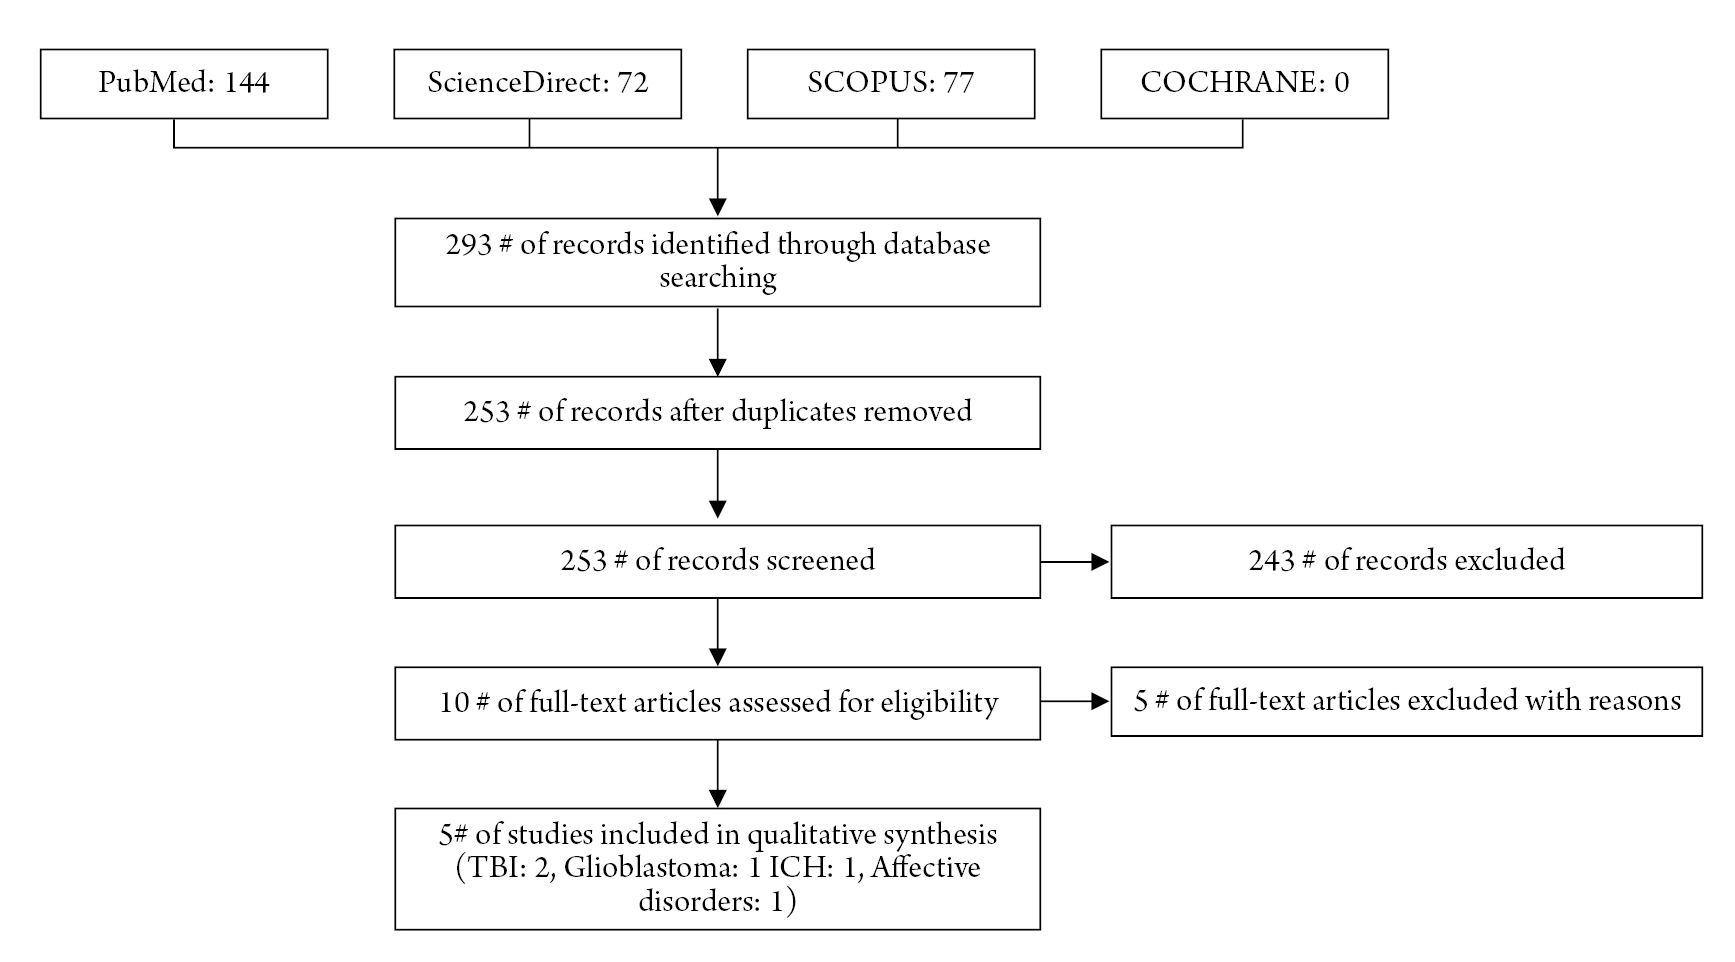
The present systematic review and meta-analysis followed the Preferred Reporting Items for Systematic Reviews and Meta-Analyses (PRISMA) guidelines15,16). Two investigators performed the literature search that included PubMed, COCHRANE, SCOPUS, and ScienceDirect (from inception to June 8th 2022) (Table 1). The studies that reported "Red Cell Distribution Width to Platelet Count Ratio" and "Outcome “in neurological conditions and the full text was published in English were included in the systematic review and if the studies two or more than two a further metanalysis was performed. For obvious reasons if the "Red Cell Distribution Width to Platelet Count Ratio" parameter was not reported, the study was excluded from the review and further analysis. Additionally, letters, case reports, reviews, preclinical studies, conference reports, and non-human studies were not considered for inclusion. After removing duplicates, the titles and abstracts of all listed articles were scanned, and the related articles were shortlisted (Fig. 1). The full text of the shortlisted articles was reviewed, and the articles were included based on our inclusion and exclusion criteria. Predesigned data collection form was used to collect individual study details, including first author, year of publication, country of origin, study type, sample size and sample details, patient population characteristics including demographic details, clinical diagnosis, Red Cell Distribution Width to Platelet Count Ratio and outcome.
RESULTS
Search resulted in 293 records, and after removing the duplicates, total five studies were found to be eligible to be included in the systematic review3-7) (Table 2). After analysing the full text, five studies were excluded; out of these four studies8,10,12)described only red cell width distribution but did not mention the details of red cell width distribution-to-platelet distribution ratio and one study11) had methodology similar to described in another article (with smaller sample size and the same source of data) by same authors3).
DISCUSSION
Haematological abnormalities or red cell parameters have been studied in various neurological and non-neurological disorders. Predicting delayed cerebral Ischemia (DCI) after Acute sub-arachnoid haemorrhage, predicting outcome after TBI especially mTBI, overall survival (OS) in Glioma, affective disorders, predicting outcome in deep seated ICH and in general cancer prognosis are few examples in which various blood parameters have been studied. The different parameters studied in these various studies are NLR, RDW, Platelet distribution width (PDW), Monocyte-Lymphocyte ratio (MLR), Platelet to Lymphocyte ratio (PLR), red cell distribution width to platelet count ratio (RPR), and NLR times RPR (NLTRP).
In a retrospective analysis12) of 222 patients with Acute sub-arachnoid haemorrhage (aSAH), of whom 11.71% developed DCI, three hematologic variables were studied to analyse their role in predicting DCI. These variables were Neutrophils to NLR, RDW and Neutrophil to Lymphocyte ratio (N/L ratio) were studied. Most patients with NLR ≥ 5.9 subsequently died (77 vs. 52%; P < 0.03). The value of RDW was predictive for DCI (area under the curve, 0.70; 95%, and obviously patients who have had DCI, had poor functional outcome on discharge (92% vs. 49%; P < 0.01) with longer duration of hospitalization (median, 20 vs. 13 days; P = 0.01).
Another review of 219 patients with gliomas8), haematological markers (NLR, Neutrophil-Lymphocyte ratio; PLR, platelet to Lymphocyte ratio; and Monocyte-Lymphocyte ratio, MLR) have shown to have prognostic value. High NLR was associated with a higher tumor grade (P = 0.000). Kaplan-Meier survival analyses revealed that the high NLR, PLR, and MLR groups experienced inferior median overall survival (OS) compared with the low NLR, PLR, and MLR groups (11 vs. 32 months; P = 0.000; 12 vs. 21 months; P = 0.001; and 12 vs. 22 months; P = 0.006, respectively). Authors reported after a multivariate analysis which demonstrated that NLR was an independent predictor of OS (hazard ratio, 1.758; P = 0.008).
In another study5) that analysed 257 newly-diagnosed glioblastoma patients where median pre-op RPR was 0.053 (IQR 0.044–0.062), the receiver operating characteristic (ROC) curve indicated an optimal cut-off value for RPR to be 0.05 (AUC 0.62; p = 0.002, 95% CI 0.544–0.685). 101 patients (39%) presented with a preoperative RPR < 0.05, whereas 156 patients (61%) had a RPR ≥ 0.05. Patients with preoperative RPR < 0.05 exhibited a median OS of 20 months (95% CI 17.9–22.1), which was significantly higher compared to a median OS of 13 months (95% CI 10.9–15.1) in patients with preoperative RPR ≥ 0.05 (p < 0.001). Authors concluded that the RPR constitute a novel prognostic inflammatory marker for glioblastoma patients and should be used in this manner.
In one of the studies3) that evaluated the role of haematological parameters for prognostication of TBI patients, data of 2,220 TBI patients was retrospectively analysed. Authors designed the research to investigate the association between red cell distribution width to platelet count ratio (RPR) and mortality risk of TBI patients. The study concluded that higher RPR can be observed among non-survivors than survivors with TBI (p < 0.001). Therefore, RPR appears to be a promising predictor of mortality for acute TBI.
In a recent article in April, 2022 Ge et.al. presented their novel research11) about prediction of deterioration after mild Traumatic Brain Injury (m-TBI) based upon usefulness of blood inflammatory markers. They concluded that NLR times RPR (NLTRP, where NLR is neutrophil-to-lymphocyte ratio and red cell distribution width to- platelet ratio) is a promising biomarker for the deterioration risk of mTBI. The combinatorial indices neutrophil-to-lymphocyte ratio (NLR), red cell distribution width to- platelet ratio (RPR), and NLR times RPR (NLTRP) were supposed to be potential risk predictors. Authors also found that NLR, RPR, and NLTRP levels were higher among deteriorated patients than non-deteriorated patients with mTBI. High NLTRP was associated with increased deterioration risk, with the odds ratio increasing from NLTRP of 1–2 (2.69, 1.48–4.89) to > 2 (4.44, 1.51– 13.08), using NLTRP of 0–1 as the reference. NLTRP had a moderately good prognostic performance with an area under the ROC curve of 0.7554 and a higher prediction value than both NLR and RPR. Study6) to evaluate the prognostic value of red cell distribution width to platelet ratio (RPR) in patients with TBI. The authors concluded that non-survivors had higher level of RPR than survivors (p < 0.001), therefore, RPR was found to be significantly associated with mortality in TBI patients.
Bobeff et al. tried to identify independent predictors of 30-day mortality or vegetative state in a geriatric population with TBI and attempted to calculate an intuitive scoring system, i.e., eTBI. Authors screened 480 patients after TBI over a 2-year period. After analysing data of 214 consecutive patients aged ≥ 65 years, including demographics, medical history, cause and time of injury, neurologic state, radiologic reports, and laboratory results, a predictive model was developed using logistic regression modelling with a backward stepwise feature selection. Starting with 20 predefined features, the final prediction model highlighted the importance of GCS motor score (odds ratio [OR], 0.17; 95% confidence interval [CI], 0.09-0.32); presence of comorbid cardiac, pulmonary, or renal dysfunction or malignancy (OR, 2.86; 9 5% CI, 1.08-7.61); platelets ≤ 100 x 109 cells/L (OR, 13.60; 95% CI, 3.33-55.49); and red blood cell distribution width coefficient of variation ≥ 14.5% (OR, 2.91; 95% CI, 1.09-7.78). The discovered coefficients were used for nomogram development. It was further simplified to facilitate clinical use. Author’s proposed scoring system, Elderly Traumatic Brain Injury Score (eTBI Score), yielded similar performance metrics.
Platelet disorders have been studied in affective disorders as well. In a study with largest number recruitment of patient with control group. In this retrospective, naturalistic, cross-sectional study7) which analysed the data of 14,007 Chinese affective disorder patients, including 4,801 patients with first episode MDD, 4,098 patients with recurrent MDD, 3,444 patients with BD manic episodes and 1,664 patients with BD depressive episodes, and 6,847 healthy subjects served as the control group. There were significant differences in mean platelet volume (MPV), PDW, plateletcrit (PCT), systemic immune-inflammation index (SII), platelet to lymphocyte ratio (PLR), platelet to albumin ratio (PAR) and red blood cell distribution width (RDW) to platelet ratio (RPR), and albumin values among the study groups. In the subjects, patients experiencing BD manic episodes had the highest mean values of MPV and SII, patients experiencing BD depressive episodes had the lowest mean values of platelet counts and PAR, and patients with D had the highest mean values of PLR and RDW. The levels of MPV, PDW and albumin were independently correlated with MDD and BD, and they areMD important predictors for differentiating patients with MDD or BD from healthy controls.
In 2021, Dai et. Al. published10) their work on red blood cell distribution width (RDW) in post-stroke depression (PSD). A total of 185 patients (retrospective analysis) with first-ever acute ischaemic stroke (AIS) were analysed where PSD patients were diagnosed at 6 months after stroke based on the DSM-IV criteria. Authors used Coefficient of Variation (RDW-CV) and standard deviation (RDW-SD) to statistically report the performance of red blood cell distribution width. At the 6-month follow-up, 46 patients were diagnosed with PSD. Compared with non-PSD patients, PSD patients exhibited an increase in RDW-CV and RDW-SD, which positively correlated with serum interleukin 6 (IL-6) concentrations. RDW-CV, RDW-SD, and IL-6 were recognized as independent predictors of PSD. The area under the receiver operating characteristic (ROC) curve (AUC) of RDW-SD was 0.796 (95% CI: 0.731-0.852) for the prediction of PSD, which was superior to that of RDW-CV. Study concluded that the specificity for predicting PSD was 60.43%, and the sensitivity was 91.30% if RDWSD was higher than 43.80 Fl.
Poor prognosis in deep seated spontaneous ICH has also been shown4) to be associated with elevated red cell width to platelet ratio. Authors analysed 102 patients with deep-seated ICH and concluded that patients with an initial RPR < 0.06 exhibited significantly lower mortality rate after 90 days than those with an initial RPR ≥0.06 (27 vs. 57%; p = 0.003). Multivariate analysis identified “ICH score ≥ 3” (p = 0.001), “anaemia on admission” (p = 0.01), and “elevated RPR ≥ 0.06” (p = 0.03) as independent predictors of 90-day mortality. Even in oncology, this has been studied by various researchers. Platelet distribution width (PDW), in a meta-analysis, has shown to be an effective and convenient indicator of cancer prognosis, with high PDW level associated with lymph node metastasis13).
In a systematic review and meta-analysis14) for predictive impact of red cell distribution width (RDW) in oesophageal cancer (EC) survival, it was found to our contrary belief that RDW cannot serve as an indicator of poor prognosis in patients with EC. However, authors recommended that it may still be a useful predictor of unfavourable prognosis using an appropriate cut-off value.
CONCLUSION
Serological biomarkers and blood components have been helpful in several cerebrovascular ailments. A strong correlation exists even in the pathology of neoplastic origin and disorders associated with psychiatric illness. The combination of haematological parameters is more productive than relying on an isolated component/ constituent of blood as the predictor of a disease condition. Future research in this direction mandates a prospectively designed, multicentric study to evaluate the influence of ethnicity and geographical variations.